Surface-Fit Graph
The Surface-Fit Graph is the central point in the TableCurve 3D Review. This graph will display the X,Y,Z data along with the surface for the fitted equation, and optionally with confidence and/or prediction intervals. The graph can be scaled and formatted, its type and view changed, a variety of file output options are available, the graph can be printed, and a full numeric evaluation can be made of the selected equation.
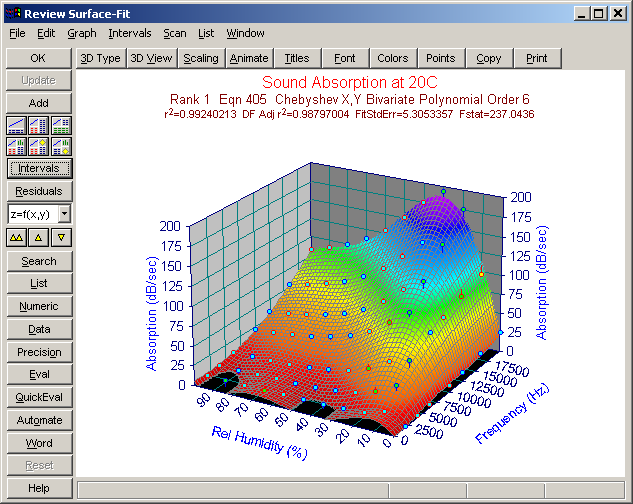
The Surface-Fit graph cannot be closed during the course of the Review. You may move and size this window as you wish, although you may not hide the OK button. The position and size of the Surface-Fit graph are saved across sessions.
Buttons Controlling Other Windows
The Surface-Fit graph is the control center for toggling on and off the other key windows in the Review:
- The List button is used to toggle the Equation List window.
- The Residuals button is used to toggle the Residuals Graph window.
- The Numeric button is used to toggle the Numeric Summary window.
- The Data button is used to toggle the Data Summary window.
- The Precision button is used to toggle the Precision Summary window.
- The Eval button is used to toggle the Evaluation window.
Automatically Tiling Windows
 The Surface-Fit Graph and Equation List are automatically opened and positioned.
 The Surface-Fit Graph, Equation List, and Numeric Summary are automatically opened and positioned.
 The Surface-Fit Graph, Equation List, and Data Summary are automatically opened and positioned.
 The Surface-Fit Graph, Equation List, and Residuals are automatically opened and positioned.
 The Surface-Fit Graph, Equation List, Numeric Summary, and Evaluation are automatically opened and positioned.
 The Surface-Fit Graph, Equation List, Residuals, and Evaluation are automatically opened and positioned.
Note that all other windows are closed when selecting one of these options and that current windows settings are replaced. Also, 1024 x 768 or greater video resolution is recommended for the options that simultaneously display four different windows.
Buttons Controlling Surface-Fit Graph Elements
The Surface-Fit graph's control panel contains buttons to:
- Select the 3D Graph Type
- Adjust 3D View Options
- Modify the Scaling of the graph
- Animate the graph at a succession of view angles
- Set Custom Graph Titles and choose a title count
- Select a Graph Font
- Modify the Graph Colors
- Select a Point Format for the graph
Copy Button
To copy the graph as a Metafile or Bitmap to the clipboard, or to save an Aldus Placeable Disk-Based Windows Metafile, use the Copy button.
Print Button
To Print the graph use the Print button. In the Review, it is possible to print a half-page numeric summary below the standard half-page surface-fit graph.
Intervals Button
The Intervals are toggled on and off using the Intervals button in the Surface-Fit Graph's control panel. The type of interval (Confidence or Prediction) and the percent limit (90%, 95%, 99%, 99.9%, or 99.99%) are set in the Intervals menu. This setting applies not only to the confidence and prediction intervals in the graph, but also to confidence limits on the parameters in the Numeric Summary, and to the confidence and prediction ranges for the data in the Data Summary as well as to all File and Printed output containing confidence information.
Scan Buttons
There are three scan buttons in the control panel. These are used to go to the top of the equation list, to scan up one equation, and to scan down one equation.
Search Button
The Search item is used to directly select the TableCurve 3D equation desired. You must enter the TableCurve 3D equation number. Given the large number of TableCurve 3D equations, it is very possible the desired equation will not be in the list. This Search option is the usually the fastest way to find a TableCurve 3D equation when you know in advance which equation it is you seek.
Real-Time Evaluation
The Quick Eval button offers the means to evaluate a few basic properties of a surface in a real time as equations are changed. Simply enter an X and Y value in order to have a Z computed automatically with each change in the surface.
Since optimizations are such an important part of surface science, the Surface Min and Surface Max check boxes allow for the display the X,Y,Z coordinates of the minimum and maximum of the surface. These are found by a two dimensional minimization algorithm that seeks 1E-8 fractional precision. Note that the minimum and maximum computation time will vary with the complexity of the individual equations.
Add

 The Add button adds a Surface Fit object to the currently selected XYZ data object in the TableCurve 3D explorer. This is a strictly an output object that cannot be further processed. You must select the surface fit equation and click Add for each equation you want to transfer into the notebook.
Update
If a Surface Fit item is currently selected in the notebook and the main graph is clicked, the previously fitted equation set is refitted, the Review is started, and the Update button will be enabled. This button updates the surface fit with the currently selected equation as well as updating all graph customizations.
Batch Automation
The Automate button activates the TableCurve 3D Automation facility. This allows unattended processing of large numbers of data sets. The data sets can be consolidated in an Excel file or acquired using a DLL. The graphs and reports can be exported to a Microsoft Word/RTF file, while the processed data can be exported to an Excel 95 or Excel 97/2000/XP file.
The automation should consist of similar data sets since only the currently selected surface-fit equation is fitted. All data sets in the automation are fitted to this one model.
If an Automation session is in progress, the Reset button can be used to terminate the automated processing.
Note that certain equations may fail to be successfully fitted, or the data count may be insufficient to allow a degree of freedom for the fit error. In all cases, a report is displayed after the automation indicating which fits failed and which ones succeeded.
MS Word/RTF Export
The Word button is used to write a report containing one of more of the following elements to an MS Word or RTF file: current surface-fit graph, residuals graph, numeric summary, data summary, precision summary, evaluation, language code, and equation list. This option can also be invoked by using the Stream to MS Word option in the File menu of the Surface-fit graph.
Surface Type
The Partial Derivative option allows for the following surfaces:
- z=f(x,y) - the actual model equation
- dz/dx - the first partial derivative with respect to X
- dz/dy - the first partial derivative with respect to Y
- d2z/dzdy - the partial derivative with respect to both X and Y
- d2z/dx2 - the second partial derivative with respect to X
- d2z/dy2 - the second partial derivative with respect to Y
You may observe significant differences in partial derivative surfaces across candidate equations. Partial derivatives are computed numerically.
Copy Button
To copy the graph as a Metafile or Bitmap to the clipboard, or to save an Aldus Placeable Disk-Based Windows Metafile, use the Copy button.
Print Button
To Print the graph use the Print button. In the Review, it is possible to print a half-page numeric summary below the standard half-page surface-fit graph.
On Graph Operations
If you place the mouse cursor on a data point, the numeric value of the residual and data point information will be shown in the information bar. You may click within the titles area of the graph to invoke the Custom Titles option, to the left or below the graph to open the Scaling dialog, and within the graph itself to adjust the 3D View.
File Menu-File Export Options
You may export the surface-fit information to an Excel XLS worksheet, a Lotus 123 WK3 worksheet file, or a Quattro Pro Windows WB1 file. You may also export the surface fit to a SigmaPlot Windows SP5 graph file. There are three ASCII export options, one to save the Generated Surface, another to save the Parameters, and a third to save the Covariance Matrix. TableCurve 3D can also generate Language Code for the surface-fit equation in C, PASCAL, BASIC, or FORTRAN.
File Menu-Preferences
The Preferences option is used to set the precision in the axes labels and titles and to turn on and off the options for fast bitmap refresh of graphs, for right filling numeric values with zero, for updating text windows when sliding the scroll bar, and for adding a volume under the surface to the numeric summary.
File Menu-Printing
To Print the graph you may use the Print button or the Print menu item in the File menu. You may set up the desired printer with the Printer Setup menu item, or the Setup button in the Print dialog. In the Review, it is possible to print a half-page numeric summary below the standard half-page surface-fit graph.
Edit Menu-Copy
To copy the graph as a Metafile or Bitmap to the clipboard, or to save a disk-based image file, you use the Copy button or the Copy item in the Edit menu.
Graph Menu
These items are also available in the button control panel. You may use these menu items to select the 3D Graph Type , to adjust 3D View Options , to modify the Scaling of the graph, to select a Point Format for the graph, to set Custom Graph Titles and choose a title count, to select a Graph Font , to modify the Graph Colors and to Animate the graph at a succession of view angles.
Intervals Menu
The Intervals are toggled on and off using the Intervals button in the Surface-Fit Graph's control panel. Simply select the Confidence or Prediction items to select the Interval type for display. You may select 90%, 95%, 99%, 99.9%, or 99.99% as the confidence limit for the Review. This applies not only to the confidence and prediction intervals in the graph, but also to confidence limits on the parameters in the Numeric Summary, and to the confidence and prediction ranges for the data in the Data Summary as well as to all File and Printed output containing confidence information.
Scan Menu
The First Equation, Next Higher Rank, and Next Lower Rank items duplicate the arrow buttons in the control panel and are likewise used to select the highest ranked fit, the next higher ranked fit, and the next lower ranked fit. The Last Equation item selects the worst ranked equation in the set.
The Search Specific Equation item is used to directly select the TableCurve 3D equation desired. You must enter the TableCurve 3D equation number. Given the large number of TableCurve 3D equations, it is very possible the desired equation will not be in the list. This Search Specific Equation option is the usually the fastest way to find a TableCurve 3D equation when you know in advance which equation it is you seek.
List Menu
This menu completely duplicates the content items in the Equation List window's own menu. The Equation List window's menu will not be shown if it is small in size. All output options associated with the Equation List are available only via the Equation List window's own menu. If the menu is not shown, simply maximize the Equation List window in order to display the menu.
Window Menu
The Surface-Fit Graph item will simply make the Surface-Fit graph the current window since this graph is always displayed in the course of the Review. The selection of Residuals Graph, Equation List, Evaluation, Numeric Summary, Data Summary, or Precision Summary will display this window if it is not already displayed, and then it will give this window the current focus.
The six Tile items are used to automatically open and place various windows. These options are also available in the Surface-Fit graph's control panel:
- The Tile Fit Graph/Equation List item automatically opens and positions the Surface-Fit Graph and Equation List.
- The Tile Fit Graph/Equation List/Numeric item automatically opens and positions the Surface-Fit Graph, Equation List, and Numeric Summary.
- The Tile Fit Graph/Equation List/Data item automatically opens and positions the Surface-Fit Graph, Equation List, and Data Summary.
- The Tile Fit Graph/Equation List/Numeric/Residuals item automatically opens and positions the Surface-Fit Graph, Equation List, Numeric Summary, and Residuals.
- The Tile Fit Graph/Equation List/Numeric/Evaluation item automatically opens and positions the Surface-Fit Graph, Equation List, Numeric Summary, and Evaluation.
- The Tile Fit Graph/Equation List/Residuals/Evaluation item automatically opens and positions the Surface-Fit Graph, Equation List, Residuals, and Evaluation.
The Save State of Review Windows option saves a file that contains the information for the current state of the Review windows. This includes which windows are currently shown and their size and positions. These are binary files with a default WIN extension.
The Import State of Review Windows option reads a WIN file and opens the appropriate windows in their previously saved sizes and positions.