3D Type
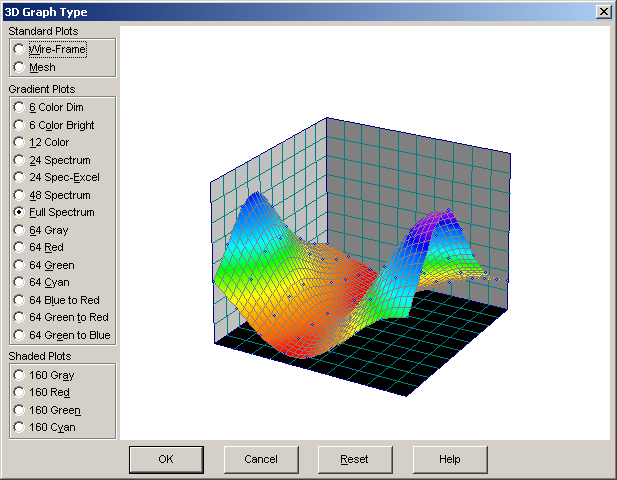
The 3D Type option is available in all of TableCurve 3D's principal graphs containing a surface. There are four basic types of graphs, a wire-frame plot, a mesh plot, gradient plots, and shaded plots.
Wire-Frame Plot
A wire-frame graph draws the surface by a continuous series of lines. Hidden lines are not removed. This is by far the fastest and simplest plot, but is of limited usefulness in serious surface-fitting work. The color of the wire can be modified via the Wire Line item in the Customize Colors option.
Mesh Plot
A mesh plot draws the 3D surface by a series of filled polygons drawn from back to front. Hidden lines are removed in this type of plot. This standard mesh plot is the TableCurve 3D default. The color of the mesh line and the color of the mesh fill can be modified by the Mesh Line and Mesh Fill items in the Customize Colors option.
Gradient Plots
The TableCurve 3D gradient plots include two 6-color (6 Color Dim and 6 Color Bright), one 12-color (12 Color), one 24-color (24 Spectrum), one 24-color matched to Excels default 256-color palette (24 Spec-Excel), one 48-color (48 Spectrum), one continuous color (Full Spectrum), and seven 64-color (Gray, Red, Green, Cyan, Blue to Red, Green to Red, Green to Blue). In these plots, the Z-range of the graph is mapped to a gradient of colors and the polygons are drawn within this overall gradient.
A gradient plot will involve drawing a significantly larger number of polygons, especially with the continuous and 48 color plots, and as such, gradient plots are the slowest in the program and the most computationally demanding. The 6-color and 12-color gradients are primarily for backward compatibility with prior versions. The colors within the gradients are not adjustable.
The 24 Spectrum gradient is available in a custom palette which uses exact colors contained within the palette defined by Excel when a 256-color video setting is used. This enables you to paste a TableCurve 3D plot into Excel and have exactly the same colors as the 24 used by TableCurve 3D. Note that this option is of value only in 256-color mode. In higher color modes, Excel should adequately render all colors within TableCurve 3D's plots.
Shaded Plots
In a shaded plot, the brightness of each mesh element is adjusted for the spectral illumination that would be produced by the light source specified in the 3D View option. This light source is specified by angular shifts from the main view angles. The default XY angular shift of +30 degrees and Z angular shift of +15 degrees is similar to holding a point source of illumination above and to the right of the viewer. Shaded plots are faster than gradient plots since the number of polygons to be drawn is no higher than that of a standard mesh plot. The four available shaded plots are 160 Gray, 160 Red, 160 Green, and 160 Cyan.
Color Schemes
The program's color schemes have been primarily designed for standard mesh plots. With the large number of colors present in the gradient and shaded plots, it is inevitable that conflicts will arise with the various colors used in data points, drop lines, and interval lines used in Surface-Fit graphs. When using gradient and shaded 3D graphs, you should use the Customize Colors option to design graph elements that work well with the particular gradient of colors that comprise the surface.
Restoring Default
The Reset button restores the program's default mesh plot.