Residuals Graph
The Residuals Graph is a separate window displaying the residuals for the current surface-fit. You may display a residuals scatterplot, a residuals % scatterplot, or a residuals non-parametric surface graph.
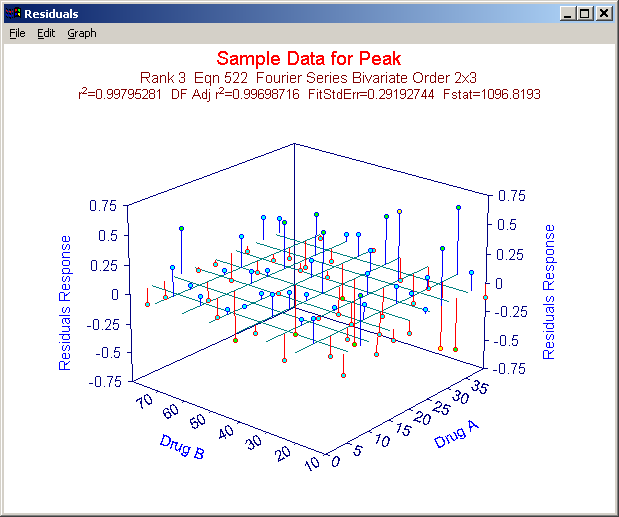
The standard residuals graph also doubles as a standardized residuals graph if the Point format specifies the coloring of residuals by fit standard error. You will probably find it easiest to discern systematic trends in the residuals by using only outline backplanes and only an XY plane grid when viewing a scatterplot type graph.
The Residuals Graph is toggled on and off by the Residuals button or the Residuals Graph Windows menu item in the Surface-Fit Graph window. You may also close the Residuals Graph directly. The window size and position you choose for the Residuals Graph is automatically saved across sessions.
File Menu
The Save As item is used to save the residuals to an X,Y,Z ASCII file, to a Lotus WK1 file, to a Lotus WK3 file, to an SPSS SAV file, or to a SYSTAT SYS file. A residuals file can be read back into TableCurve 3D for fitting. To Print the graph use the Print menu item. You may set up the desired printer with the Printer Setup menu item, or the Printer Setup button in the Print dialog. In the Review, it is possible to print a half-page numeric summary below the standard half-page residuals graph.
Edit Menu-Copy
To copy the Residuals graph as a Metafile or Bitmap to the clipboard, or to save an Aldus Placeable Disk-Based Windows Metafile, you use the Copy item in the Edit menu.
Graph Menu
You may use these menu items to adjust 3D View Options , to modify the Scaling of the graph, to select a Point Format for the graph, to set Custom Graph Titles and choose a title count, to select a Graph Font , to modify the Graph Colors and to Animate the graph at a succession of view angles.
The Graph menu also contains the four types of available residuals graphs:
· Residuals Graph
· Residuals Surface Graph
· Residuals % Graph
· Residuals SE Graph
The Residuals Graph consists of a 3D scatterplot of the actual residuals values. The Residuals % Graph is similar but plots the residuals as a % of the original Z-Value. The Residuals SE Graph plots the residuals in a standardized format (relative to the overall standard error of fit).
The Residuals Surface Graph plots a non-parametric surface using the Renka I procedure. An interpolated residuals surface may be very useful for discerning systematic trends and detecting outliers.
Largest Magnitude Residual
In a 3D residuals graph, it is not always an easy task to immediately locate the point with the largest magnitude residual. Since this is often an important element in graphical inspection, TableCurve 3D offers the means of isolating this point simply by clicking the right mouse button when over the residuals graph. The cursor will jump to the point whose residual has the largest absolute value.