Excel, Lotus, Quattro Pro Export
You may export TableCurve 3D's Surface-Fit to an Excel XLS, a Lotus WK3, or a Quattro Pro WB1 spreadsheet file.
These options to export a surface-fit worksheet are found in the File menu of the Surface-Fit Graph.
- The Save Excel option is used to write an Excel XLS.
- The Save Lotus 123 option is used to write a Lotus WK1 or WK3.
- The Save Quattro Pro Win option is used to write a Quattro Pro Windows WB1.
 .
.
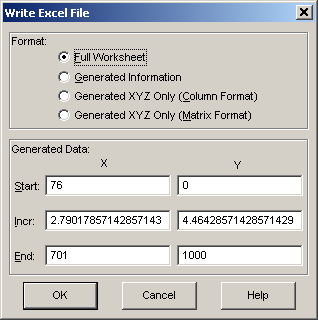
Four formats are offered varying from all surface-fit information to simple generated XYZ data in either a columnar or matrix format:
The Full Worksheet item writes all possible information to the worksheet including fit parameters, fit statistics, the original data with predicted values and confidence and prediction limits, and a generated section which contain X,Y values determined by the values in the Start, Incr, and End fields. This generated section will contain the predicted Z value as well as confidence and prediction intervals. The initial values in the X and Y generation will be based upon the current mesh counts, essentially offering the same vertex points as those in the TableCurve 3D surface graph. The confidence value used will be the value currently set in the Intervals menu.
The Generated Information option writes only the generated columns, including the confidence and prediction limits.
The Generated XYZ Only (Column Format) option writes only the X,Y,Z information defining the surface to the first three spreadsheet columns.
The Generated XYZ Only (Matrix Format) writes the X values to the first row and the Y values to the first column. The Z-values are written into the matrix. This format can be used to create Excel and Quattro Pro Windows surface plots.
The initial default values for the generated data produce the actual mesh of the surface-fit graph. Note that when the TableCurve 3D graph mesh count is set to a very high resolution, such as the 250 x 250 maximum, 62,500 vertices exist. This remains within Excel's 65,536 rows. If the file will be used with an older spreadsheet having a 16,384 row limitation, you should restrict the mesh counts in TableCurve 3D to 127 x 127.
Excel Surface Plot from Exported Matrix
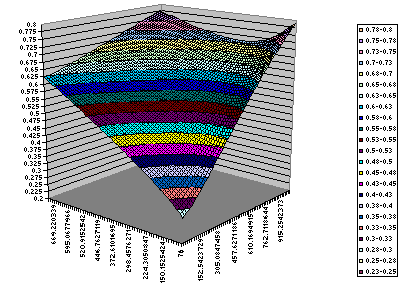
Once in Excel, in order to create a 3D surface graph from the exported matrix, select the whole of the exported matrix and select the 3-D Surface option in Surface chart type. Right click on the legend and in the Scale tab of the Format Legend dialog, set a Major unit for the z range to determine the number of discrete gradients in the plot.
Inserting BASIC Module in Excel
For Excel 97 and higher versions supporting VBA (Visual Basic for Applications), you can add a BASIC module containing the curve-fit equation to the XLS file. Although it involves several steps, this approach has the advantage of producing a viable formula for all TableCurve 3D equations, including the Chebyshev and Fourier Series equations.
This approach makes the surface-fit function global to Excel just as if it were a built-in Excel function. Further, the BASIC code is generally easier to understand than the single line formula generated in this Save Excel option since the coefficients appear directly rather than as cell references.
Note that you can use this option even if you have no experience with BASIC because no language understanding is needed.
The necessary steps are as follows:
In TableCurve 3D:
- Generate Function Code using Visual Basic or QBASIC, Function Code Only.
- Generate the Excel file using this Save Excel export option
In Excel:
- Open the generated Excel file
- Tools/Macro/Visual Basic Editor to open the VB editor
- File/Import File with the generated BASIC file name to add the VB module to the worksheet
- Use the generated function name in formulas anywhere within the Excel sheets as in =eqn324(A1,B1)