Section Data
Graphical sectioning is available in the View menu's Section Data procedure. Graphical sectioning is a convenient means for excluding or including a specified region of points for the surface-fit processing. To toggle individual points on and off, this option also offers on-graph editing.
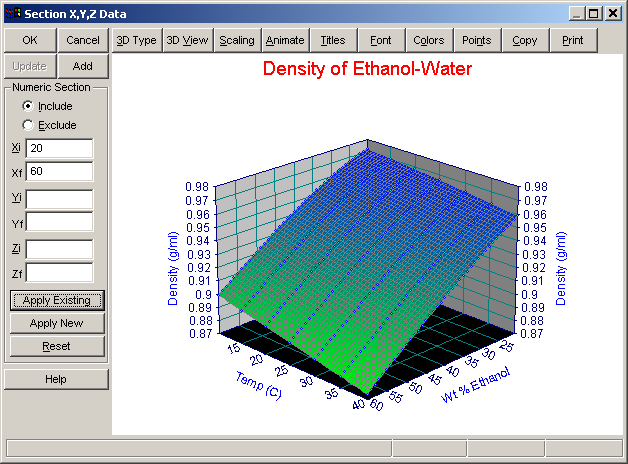
Range Sectioning
The sectioning dialog consists of a separate 3D graph of the data which will display the results of applying the sectioning. The sectioning can be set to either Include or Exclude the points in the specified region. A sectioning region consists of 3D "box" which is defined by an initial X [Xi], a final X [Xf], an initial Y [Yi], a final Y [Yf], an initial Z [Zi], and a final Z [Zf]. If no entries are made for a given variable, the program assumes the full range of the variable when including points, and no range on the variable when excluding points. You may have as many active and inactive regions as you like.
To apply the sectioning to the data, you must select either the Apply Existing or Apply New button. The Apply Existing applies the given region to the current status of the points whereas the Apply New option resets all points prior to the sectioning. After applying the sectioning, the excluded points will be displayed in the color currently specified for Inactive data points. To modify this inactive point color, use the Colors option in the main graph and choose the Customize Colors button. To restore all points to an active status, use the Reset button.
On-Graph Editing
If you need to change the status of a large number of data points that exist within a rectangular 3D region, the range sectioning option will accomplish this in a single step. For isolating and deactivating individual points, on graph editing should be used. This graphical X,Y,Z editing toggles individual points between an active and inactive state. This operation begins by placing the cursor directly on a data point. A special cursor will show that a point is contained inside and the information display below the graph will indicate the point detected and its status. To change the status of the data point, simply click and release the left mouse button. The point's color will change to reflect its new status.
Note that You may also check each X,Y,Z point as inactive in the TableCurve 3D Editor.
Add
 The Add button adds a Section object to the currently selected XYZ data object in the TableCurve 3D explorer. A Section operation can be added to any item containing XYZ data, including other sectioned items. Since a Section item covers both range sectioning and individual point editing, the object it consists of the state of each and every point. For this reason, a section object cannot be dragged and dropped (or copied and pasted) in the TableCurve 3D explorer.
 If all points are active, a View item is stored in response to Add.
Update
If a Section item is currently selected and the main graph is clicked, the Update button will be enabled. This updates the sectioning with the current state of the points as well as updating all graph customizations.
Note that the Add or Update options must be invoked before closing the dialog in order for the section item to be added to the current notebook.