Intervals
Confidence Intervals
A 95% confidence interval is the Z-range for a given X,Y that has a 95% probability for containing the true Z value for that which the data represents, whether it is a single experiment or many. Note that "true" is defined as the true value for the experiment(s) represented by the data, not for the process that is generating the data. If the underlying process is assumed static, unchanging in its properties and the data it generates, the confidence intervals can approach, as the number of replicates becomes large, the mapping of the true value for the underlying process.
It is for this reason that confidence intervals are useful for replicated data where, for each X,Y, you have either many Z observations or a single Z value which represents an average from many Z observations. Note that when each Z value in the data set consists of an average from many observations at the same X,Y, the point is often weighted with the inverse square of the standard deviation. With many Z observations at a given X,Y, the average Z can be said to approach the true Z value of the process itself, since the errors will sum to zero. Thus, with sufficient replicates, a confidence interval can suggest the error band about the true value for the underlying process that is assumed static and generating the data.
Prediction Intervals
A 95% prediction interval is the Z range for a given X,Y where there is a 95% probability that the next experiment's Z value will occur, based upon the fit of the present experiment's data.
Prediction intervals are useful for predicting, for a given X,Y, the Z value of the next experiment. It is often used when a fit represents a single experiment, where each Z value is a single observation. In this case, the weight for each Z value isn't based upon a standard deviation from multiple observations, but rather is inversely related to the experimental uncertainty for the individual X,Y measurement, if such is known. If the uncertainty of the Z measurement is unknown or thought to be equal for all X,Y, all points can use equal 1.0 weights.
If the data consist of replicates that are appended together and fitted or where a fit is made of the averages, the prediction intervals that result can only predict the next instance of this same type number of replicates processed in this same way. For this reason, prediction intervals are primarily useful for a single set of observations.
Local Measure of Error
Confidence and prediction intervals measure the confidence only at a specific X,Y, not for the entire X,Y data region. These must be computed for each X,Y value in the surface. This can be computationally intense when intervals are computed for a large number of X,Y values.
There is often a strong similarity between points which lie outside 2 standard errors and the 95% prediction interval. These are not identical, however.
The standard error of fit is based upon the overall fit. It matters not if a point is near a portion of the surface well characterized by the fit, or one only poorly so. A certain standard error in Z exists for the overall fit, and a point with a residual whose magnitude lies beyond a given multiple of this value is drawn in a certain color.
The prediction interval, on the other hand, is a more localized measure of error. Points near a region of the surface strongly determined by the fit will have a tighter confidence interval than those points near a region of the surface only weakly determined in the fit. Generally, strongly determined regions will have a good number of accurate data points whereas poorly determined regions will have few points with considerable variability.
Confidence Interval Map
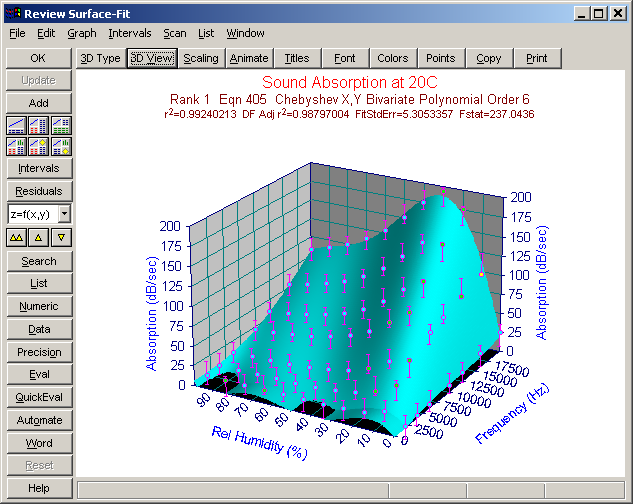
TableCurve 3D plots a confidence interval map. A confidence interval map is really two continuous surfaces, one lower and one higher in Z values, although it must be computed at discrete X,Y values in order to generate this map. In TableCurve 3D, this is shown as z-bars at the data points. Note that the intervals are always smaller at the data points and increase at X,Y coordinates some distance from the nearest points. If you need an accurate confidence interval map, do not use the Data Summary, but instead use the Generate Table feature in the Evaluation option with a density of generated values that fully map the X,Y region of interest.