Evaluation Procedure
The Evaluation procedure offers extensive numerical evaluation of parametric and non-parametric models. Use this option to find function evaluations, roots, derivatives and cumulative areas. This option's Generate feature enables the creation of any data table based upon the equation being evaluated.
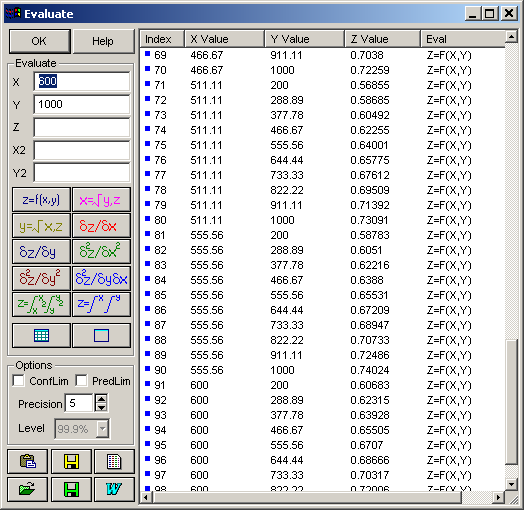
Single Data Input
This aspect of the Evaluation requires individual data input from the keyboard. Enter a value in the X, Y, X2, Y2 and Z field and then click on the desired function operation.
The following operations are available:
 Evaluate the function at X,Y.
 Find all roots (X-values) at Y,Z.
 Find all roots (Y-values) at X,Z.
 Evaluate the first partial derivative at X.
 Evaluate the first partial derivative at Y.
 Evaluate the second partial derivative at X.
 Evaluate the second partial derivative at Y.
 Evaluate the partial derivative at X, Y.
 Evaluate the Volume from the lower bound of the data range (or function plot range) to X, Y.
 Evaluate the cumulative Volume from X to X2 and Y to Y2.
The result is placed in the Evaluation Table. This table is a sorted list window that accumulates all manually or automatically generated data. The table lists the data element, the X value, the Y value, the Z value and the type of function operation that produced the data.
The list can be sorted by X value, Y-value, Z-value, evaluation type, and by magnitude of the confidence interval. Click on the desired table header to initiate a sort. A second click on the same heading reverses the order of the sort.
Precision
The number of significant figures used in the table can be set anywhere from 3 to 15 using the Precision option.
Confidence or Prediction Limits
If you are evaluating a Surface-Fit equation, you can also check the ConfLim or PredLim items. In these instances, the confidence or prediction limits will be computed for the surface at the X,Y, Z listed and these will be included in two additional columns. The initial will be that interval limit currently set in the Review. The Level drop down box allows any of the confidence levels to be set.
Volumes
The cumulative volume computations use a Gaussian Quadrature procedure. The precision attained is shown in brackets. A minimum fractional error of 1E-8 is sought.
Generate Table
 The Automatically Generate Table Entries option is used to automatically create either the evaluation table or a file from the function being evaluated. You have the option of generating the input values by specifying the starting value, increment (or count), and ending values, or you can read the input values as a column from any ASCII, Lotus, Excel, SigmaPlot, Quattro Pro, dBase, DIF, SPSS, or SYSTAT file. The computed values can be Z=F(X,Y), X=Root(Y,Z), Y=Root(X,Z), Z=dF(X,Y)/dX, Z=dF(X,Y)/dY, Z=d2F(X,Y)/dX2, Z=d2F(X,Y)/dY2, Z=d2F(X,Y)/dXdY, Z=Volume(Xmin,X,Ymin,Y), Z=Volume(X,X2,Y,Y2). You can use this option to generate a file or to fill the evaluation table, up to a limit of 16384 entries.
Note that a Windows sorted list is quite slow when a large number of entries are being generated. In such an instance, it may be advantageous to generate the data directly to file.
Clearing the Evaluation Table
 To clear the contents of the Evaluation table, use the Clear All Table Entries button in the button panel.
Saving the Evaluation Table Data
 To save only the X, Y and Z columns of the Evaluation table, use the Save Data to Disk button. You can save the data to an ASCII file, to WK1, WK3, Excel 95, or Excel 97/2000/XP spreadsheet files, to an SPSS SAV file, or to a SYSTAT SYS file. The ASCII files are written to 17 digits of precision. The binary formats offer 15 digit precision except for the WK3, which offers 19 digits. These files can be subsequently imported into TableCurve 3D's data table.
Copying the Evaluation Table Data to the Clipboard
 To copy only the X,Yand Z columns of the Evaluation table to the Windows clipboard, use the Copy Data to Clipboard button. This copies the XYZ data as 17 digit precision space-delimited ASCII text, in a 15 digit precision WK1 format, and in a full 19 digit precision WK3 format.
Listing/Printing the Evaluation Table
 The List Data option places the evaluation table in a TableCurve 3D text window that can be printed and edited.
Saving an Evaluation Sequence
 An evaluation sequence can be saved to disk for re-application to any new model or equation. Use the Save Evaluation Sequence to Disk button to save an EVS (evaluation sequence file). These are binary files that can only be created from within TableCurve 3D.
When the Evaluation is closed, you will be asked if you want to save an unsaved evaluation sequence only if manual entries have been made. This query is not made for automatically generated tables.
Importing an Evaluation Sequence
 An EVS file can be imported using the Import Evaluation Sequence from Disk button. When a sequence is imported, the existing entries in the table are cleared. If manual entries have been made, you will be presented an option to first save the existing evaluation sequence.
MS Word/RTF Export
 The MS Word/RTF File Export option is used to save the current evaluation table to either a MS Word file or a portable RTF (Rich Text Format) file.