Interpolate Uniform Grid
If you have need to generate exact interpolated data on a uniform grid, possibly to constrain parametric fits in regions lacking data, the Interpolate to Uniform Grid option in the Non-Parametric menu offers an automatic solution. The option can also be used to digitally filter or enhance any given data set.
This option creates an XYZ interpolation object in the TableCurve 3D notebook. Most of the capability of the Estimate Scattered Data option is included.
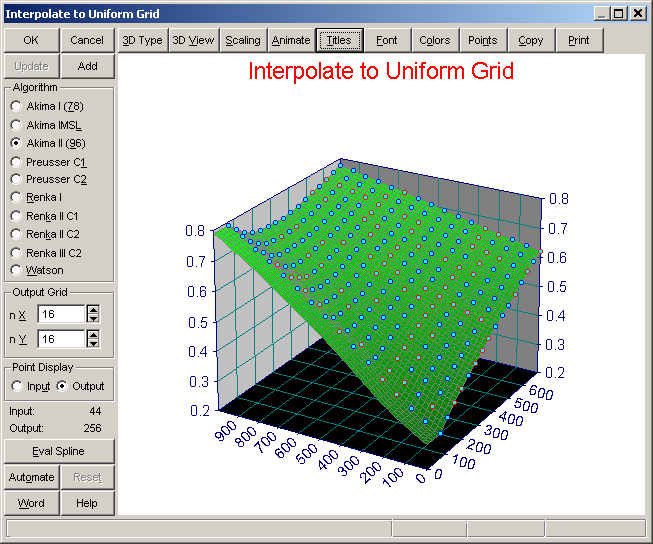
Algorithms
Ten different options are available:
- Akima I (78)
- Akima IMSL
- Akima II (96)
- Preusser C1
- Preusser C2
- Renka I
- Renka II C1
- Renka II C2
- Renka III C2
- Watson
Interpolation
The algorithms are strictly interpolation routines whose surfaces pass exactly through the data. No data smoothing occurs. Extrapolation may occur to fill in the corners or edges of the rectangular grid. The grid is automatically specified by the bounds of the input data.
Output Grid
The number of elements in the x (nX) and y (nY)output grid can be set independently. Values between 4 and 128 are permitted for each grid.
Point Display
The display can consist of either the Input data or the Output grid.
Eval Spline
The output grid is automatically fitted to a bicubic B-spline. To numerically check on the validity of any aspect of a gridding operation, the Evaluation of this interpolated spline may be of some value.
Graph Controls
This option offers the common TableCurve 3D graph controls:
Add
 The Add button adds an Interpolate to Uniform Grid object to the currently selected XYZ data object in the TableCurve 3D explorer. This operation can be added to any item containing XYZ data.
Update
If an Interpolate to Uniform Grid item is currently selected and the main graph is clicked, the Update button will be enabled. This updates the interpolation with the current settings as well as updating all graph customizations.
Batch Automation
The Automate button activates the TableCurve 3D Automation facility. This allows unattended processing of large numbers of data sets. The data sets can be consolidated in an Excel file or acquired using a DLL. The graphs and reports can be exported to a Microsoft Word/RTF file, while the processed data can be exported to an Excel 95 or Excel 97/2000/XP file.
If an Automation session is in progress, the Reset button can be used to terminate the automated processing.
MS Word/RTF Export
The Word button is used to save the current graph to either a MS Word file or a portable RTF (Rich Text Format) file. The graph is inserted into the file as a Windows metafile.
Preserving the Current Interpolation Settings
Exit with OK to update the procedure's settings. These values will be reflected the next time the procedure is entered. To discard the current settings, close the procedure with the Cancel button. Note that the Add or Update options must be invoked before closing the dialog in order for the interpolation to be added to the current notebook.