Non-Linear Sampler
The Non-Linear Sampler option in the View menu displays examples of TableCurve 3D's non-linear equations. This is the fastest way to familiarize yourself with the 168 built-in equations and to see what is meant by the various profiles.
Simply select the equation of interest and a profile, much as you would choose an equation in the Edit Custom Equation Set procedure.
If you wish to see what a function would look like in inverted form, simply check the Invert box.
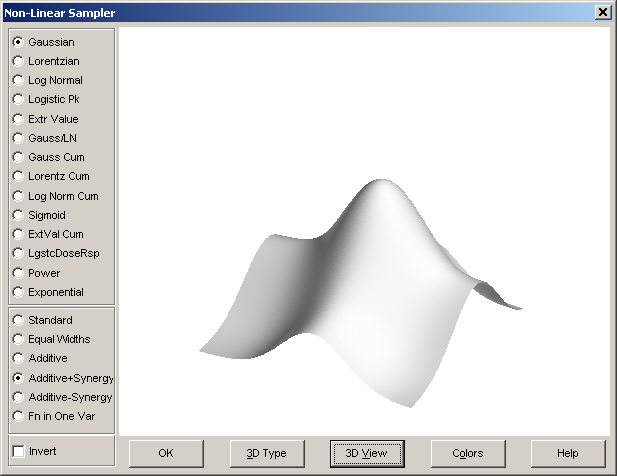
This non-linear sampler graph will be displayed using a size, position, graph type, view format, and color specific to this type of graph. These specifications are automatically saved across sessions.
Options
The Non-Linear Sampler Graph options include selecting the 3D Graph Type, adjusting 3D View Options, and modifying the Graph Colors.