Equation List
The Equation List window displays a selection list of the surface-fit equations. This list will initially be sorted by the criteria set in the Surface-Fit Preferences Process menu option. This list can subsequently be sorted by any one of TableCurve 3D's four goodness-of-fit sort criteria, by floating point execution speed, or by equation number, and its content can be filtered to only contain certain types of equations.
The Equation List window will have its own menu if it is sufficiently large. If you choose to have the Equation List displayed in a small window, its content-related functions can be accessed via the List menu in the Surface-Fit Graph window. The Equation List is toggled on and off by the List button or the Equation List Window menu item in the Surface-Fit Graph window. You may also close the Equation List window directly using its system menu.
The window size and position you choose for the Equation List is automatically saved across sessions. TableCurve 3D saves two Equation List window positions and sizes, one for the Graph Start option and one for the List Start option. Options to save the Equation List to a file, to display the list in color, and to print all or part of the list are present only in the List Window's own menu and not in the List menu of the Surface-Fit Graph. To access these functions when the Equation List is too small to have a menu, simply maximize the Equation List window.
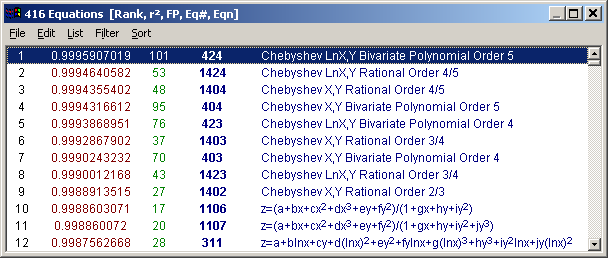
Rank
The first item in each line of the equation list will be the ranking of the equation by the goodness of fit criteria currently set. Initially, all successfully fitted equations that have been added to the list are shown. The rank will always reflect the position within all fitted and saved equations, regardless of how the list is filtered.
Goodness of Fit
The second item will be the goodness of fit value. This may be the r² coefficient of determination, the DOF-Adjusted r², the Fit Standard Error, or the F-statistic. The current goodness of fit criteria will be shown in the window's title bar. When the All Goodness of Fit in List option in the List menu is checked, all four goodness of fit statistics will be displayed within the equation list.
Floating Point Demand
The third item will be the FP or floating point demand for the TableCurve 3D generated language code for this equation. A value of 1 corresponds to 1 floating point addition. The higher the number, the greater the execution time for the equation code. These values are based on a 486 chip with its internal math coprocessor.
Equation Number and Equation
The last items in an equation list entry will be the TableCurve 3D equation number and the equation expression.
Selecting an Equation
If you make a selection from the Equation List using a mouse, an equation is selected as soon as you click on it. All Review windows currently open will be updated to reflect the new equation. If the Equation List is the currently active window, you may also move through the list using the cursor keys and make a selection by pressing Enter. If you maximize the Equation List window, regardless of Review startup option, the Equation List window is automatically closed when a selection is made.
File Menu
The Save As option is used to save the Equation List to a simple ASCII file, to a Lotus WK1 file, to a Lotus WK3 file, or to a fully formatted Rich Text Format (RTF) file. In the case of the ASCII text, WK1, and WK3 files, superscripts are not preserved.
A save to the RTF format seeks to exactly preserve the appearance of the equation list when imported into word processing and desktop publishing products. This option preserves columnar formatting, font colors, bolding, superscripts, and subscripts. In order to save a black and white RTF text file, you will need to uncheck the Color option in the List menu.
Use the Printer Setup item to select the current printer and optionally to configure the printer's own driver.
The Print item is used to print either the currently displayed contents of the list, or the entire list. The Text Print dialog is used to customize the printing of the information.
Edit Menu
The Copy option copies the full equation list, memory permitting, to the Windows clipboard as unformatted ASCII text, as formatted Rich Text Format (RTF) text, and in the Lotus WK1 format. The unformatted text format is space delimited and is used when you to paste the equation list into a text-based program.
The RTF format seeks to exactly preserve the appearance of the list when pasted into word processing and desktop publishing products. The RTF format preserves columnar formatting, font colors, bolding, superscripts, and subscripts. In order to save a black and white RTF text file, you will need to uncheck the Color option in the List menu prior to the Copy.
For some products where RTF is the default clipboard format, such as Microsoft Word, you will need to use a Paste As, Paste Special, or similar option in order to specifically select the unformatted text. When you paste the equation list into a spreadsheet, the WK1 format is used.
The ASCII Editor option copies the equation list into the TableCurve 3D ASCII editor. On Windows 98 and ME, the maximum size is about 700-800 equations.
List Menu
When the Keep List After Selection is checked and the Equation List window is not maximized, the Equation list is not removed after a selection is made. If this Keep List After Selection is not checked, or if the Window is maximized, the Equation List window is closed after each selection.
When the All Goodness of Fit in List option is checked, all four goodness of fit statistics will be displayed within the equation list. First will be the r² coefficient of determination, then the DOF-Adjusted r², the Fit Standard Error, and finally the F-statistic.
The style items include setting a font for the list. This Font for List font selection is unique to the Equation List. The Color option toggles the display of the list between color and black and white.
Filter Menu
All of the Filter Menu items are also in the Surface-Fit Graph's List menu. You may apply six different filter options to the equation list so that it contains All Equations, only the three parameter Simple Equations, only Polynomial/Rational Equations, only Polynomial Equations, only Rational Equations, or only Non-Linear Equations. These options reset the selected equation to the first within the list.
Sort Menu
All of the Sort Menu items are also in the Surface-Fit Graph's List menu. You may sort the current list at anytime by r2 coefficient of determination, by DOF-Adjusted r2, by Standard Error (Root MSE), by F-statistic, by Floating Point Speed, or by TableCurve 3D Equation Number.
If you want the best possible least squares fit, use either the DOF-Adjusted r2 or the Standard Error criteria.
If you want the equation which represents the best possible model for describing the data, use the F-statistic. The F-statistic sort will often bring many simpler equations nearer the top of the list if the equations do a respectable job describing the data using a modest number of coefficients.
The Arrange by Parameter Count option will use the coefficient count as the primary sort key, and the selected goodness of fit sort criterion as the secondary key. When this option is selected, all of the three parameter fits will be at the top of the list. Within each parameter count grouping, the equations will be sorted by the currently selected goodness of fit.
A sort always resets the selected equation to the first equation in the list.