Preferences
TableCurve 3D's Review Preferences are available from both the File menu of the Surface-Fit Graph and from the Review menu of the main window.
These preferences include setting the precision in the axes labels and titles, right filling numeric values with zero, updating text windows when sliding the scroll bar, and adding a volume below the surface to the numeric summary. You may also control how the graphs are drawn.
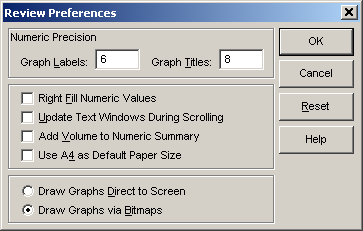
Numeric Precision Graph Labels
This preference controls the number of significant figures used in the X, Y, and Z axes value labels. The default is six significant figures. You may set anywhere from 3 to 8 significant figures.
Numeric Precision Graph Titles
This preference controls the number of significant figures used in the fit statistic and coefficient titles of the graph. The default is 8 significant figures. You may set anywhere from 3 to 15 significant figures.
Right Fill Numeric Values
This option applies to tabulated numeric information in the Review's text windows. When selected, this option results in right filling all numeric values with zero. For example, the value of 1 would appear simply as 1 without this option set, and as 1.0000000 with this right fill in place.
Update Text Windows During Scrolling
This option also applies to text windows. When selected, the text window is updated when the scroll thumb is moved while the mouse button is held down. Note that this option affects all text windows in TableCurve 3D, not only those within the Review.
Add Volume to Numeric Summary
This preference adds the result of the double integral of the surface-fit equation from Xmin to Xmax, Ymin to Ymax, to the numeric summary. This computation can sometimes require a significant time, especially when singularities prevent convergence, and should be added only if the information is of some value.
Use A4 as Default Paper Size
By default, MS Word and RTF export is formatted in 8.5 x 11 size. If you want the export formatted for an A4 paper size, you must check this preference. The A4 preference applies to this MS Word and RTF export option and also to all reports generated using the Automation facility.
Drawing Method
The Draw Graphs Direct to Screen and Draw Graphs via Bitmaps options control how a graph is first rendered to the screen.
On some video systems, the Draw Graphs Direct to Screen option may be slightly faster. In this option you will see each element of the graph rendered as it is drawn.
The Draw Graphs via Bitmaps option draws the graph first to a memory bitmap and then places the bitmap on the screen. With this option, you will not see the graph rendered until it is complete and the placement on the screen will be almost instantaneous.
The default is to draw the graphs via bitmaps.