Data Graph
The Data Graph option in the View menu is used to view a 3D scatter plot or interpolated surface of the currently selected XYZ data. The graph will be displayed using a type, size, position, view format, point format, font, and color specific to View Data Graph graphs. These specifications are automatically saved across sessions and are also used for the intrinsic data items in the TableCurve 3D explorer.
A data graph can be scaled and formatted, its 3D view adjusted, and the graph can be printed or copied to the clipboard. You may click within the titles area of the graph to invoke the Custom Titles option, to the left or below the graph to open the Scaling dialog, and within the graph itself to adjust the 3D View.
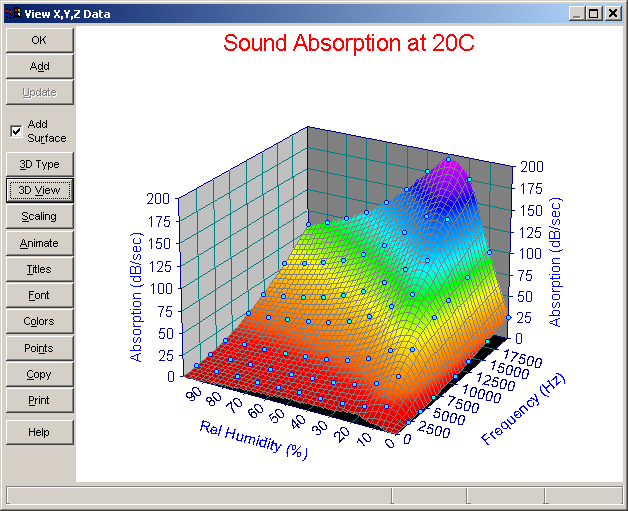
Add Surface
The Add Surface checkbox replaces the scatterplot with a surface rendered via the Renka I procedure. This option is only for basic visualization. The Estimate Gridded Data or Estimate Scattered Data options in the Non-Parametric menu should be used for non-parametric modeling.
Options
The Data Graph options include:
- Selecting the 3D Graph Type
- Adjusting 3D View Options
- Modifying the Scaling of the graph
- Animating the graph at a succession of view angles
- Setting Custom Graph Titles
- Choosing a Graph Font
- Modifying the Graph Colors
- Selecting a Graph Point Format
- Copying the graph as a Metafile or Bitmap
- Printing the graph
On-Graph Editing (Point Sectioning)
For isolating and deactivating individual points, an graph editing capability is available. This graphical X,Y,Z editing toggles individual points between an active and inactive state. This operation begins by placing the cursor directly on a data point. A special cursor will show that a point is contained inside and the information display below the graph will indicate the point detected and its status. To change the status of the data point, simply click and release the left mouse button. The point's color will change to reflect its new status.
 Note that this on-graph editing is also available in the Section Data option.
 Alternatively, you may also check each X,Y,Z point as inactive in the TableCurve 3D Editor. In this case, however, you will have to save the modified data to disk.
Add
 If no points were toggled off in the graph, the Add button adds a View Item to the currently selected XYZ data object in the TableCurve 3D explorer. This item will construct the identical data as the parent, but will have its own graph customizations.
 If one or more points were toggled off in the graph, the Add button adds a Section item to the notebook. A Section operation can be added to any item containing XYZ data, including other sectioned items. Since a Section item covers both range sectioning and individual point editing, the object consists of the state of each and every point. For this reason, a section object cannot be dragged and dropped (or copied and pasted) in the TableCurve 3D explorer.
Update
If a View item is currently selected and the main graph is clicked, the Update button will be enabled. If no points were toggled off in the graph, the Update button will update the current graph settings.
Note that the Add or Update options must be invoked before closing the dialog in order for the view item to be added to the current notebook.
Intrinsic Data Items
When an XYZ data item is specified, it first appears as an intrinsic or native data item. These items in the TableCurve 3D explorer do not contain customized graph settings, but display in the main window using the current settings in this option.