Graph Points
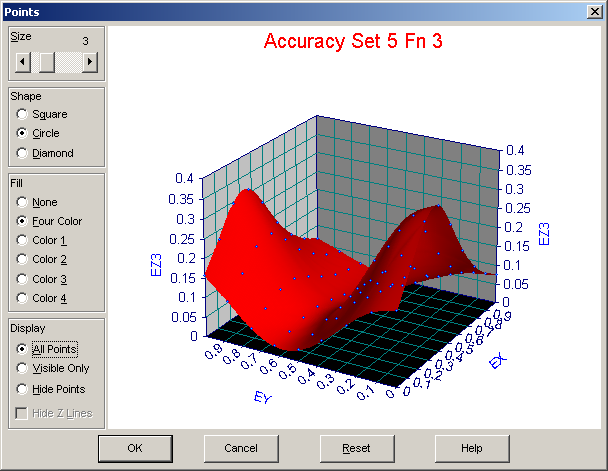
The Points item is used to set the point format for the current graph. You may set a size, select a shape, choose the type of fill, and set a display status.
Point Size
The Size scrollbar offers a Point Size varying from 1 to 10. The default size is 3.
Point Shape
You may choose from Square, Circle, and Diamond shapes. The default shape is circular.
Point Fill
Points can be unfilled by selecting the None option. The Color 1, Color 2, Color 3, and the Color 4 selections fill the points with the colors listed respectively as Points <1 SD, Points <2 SD, Points <3 SD, and Points >3 SD shown in the Customize Colors option. The 4 Color option is the default and uses all four of these colors to fill the points. In data graphs, the colors will vary with the Z value of the data point. In surface-fit graphs, the colors will vary with the residual for the data point. The first color will be used for points whose absolute value of the residual is smaller than 1 standard error of fit. The second color is used for those between 1 and 2 standard errors, the third color for those between 2 and 3 standard errors, and the fourth for those beyond 3 standard errors.
Note that this mapping based on overall fit standard error is not exactly the same as the prediction interval surface. This four color fill based upon standard error is a simple linear operation whereas the prediction interval surface will vary with how strongly a given surface is statistically determined in a given region. A point may, for example, rest slightly more than 2 standard errors from the surface but still be within a 95% prediction limit. The converse is also true as in the example of a point that rests slightly less than 3 standard errors from the surface but which lies outside the 99% prediction limit.
Point Display Format
There are three display options available in Surface-Fit graphs. The All Points option is the default. This displays all points, even if a point would normally be hidden by a different portion of the surface. This is the fastest option to display points.
The Visible Only option adds a computationally intense procedure to determine which points should be visible before drawing the graph. Note that a point is invisible only if it is occluded by a mesh element of the surface other than the one with which it is associated by the Z-drop line determining the residual. In the instance of 3D peak data, a point associated with the hidden back half of the peak would not be shown. A point associated with the visible front half of the peak would be displayed, even if the point lies within the interior of the peak. If the X,Y,Z of the surface mesh element associated with the point is visible, the point will be displayed, regardless of its position relative to this mesh element.
The final option of Hide Points is used in Surface-Fit graphs to hide the data points and display only the fitted surface.
Drop Lines
In Surface-Fit graphs, points are displayed with drop lines that connect the point with the surface. These drop lines reflect a constant X and Y, and the difference between the Z of the data point and the Z of the surface. The length of these lines thus represent the magnitude of the residual. In a standard residuals graph, the drop lines connect the X,Y,Residual point with the XY plane at Z=0. Again the length of the lines reflect the magnitude of the residual. Positive residuals are shown in one color and negative residuals in another. These colors can be modified by changing the Z-line Above and Z-line Below items in the Customize Colors option.
Reset
The Reset button is used to restore the point format defaults.