SigmaPlot Export
The Save SigmaPlot Win option in the File menu of the Surface-Fit Graph is used to write a SigmaPlot Windows file. There are three format options.
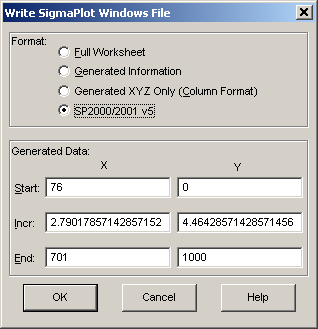
Four formats are offered varying from all surface-fit information to simple generated XYZ data in a columnar format. All formats contain a SigmaPlot Windows surface mesh plot.
The Full Worksheet item writes all possible information to the worksheet including fit parameters, fit statistics, the original data with predicted values and confidence and prediction limits, and a generated section which contain X,Y values determined by the values in the Start, Incr, and End fields. This generated section will contain the predicted Z value as well as confidence and prediction intervals. The initial values in the X and Y generation will be based upon the current mesh counts, essentially offering the same vertex points as those in the TableCurve 3D surface graph. The confidence value used will be the value currently set in the Intervals menu. An SP5 format is used which is compatible with all versions of SigmaPlot.
The Generated Information option writes only the generated columns, including the confidence and prediction limits. An SP5 format is used which is compatible with all versions of SigmaPlot.
The Generated XYZ Only (Column Format) option writes only the X,Y,Z information defining the surface to the first three worksheet columns. Each of the formats will also contain a SigmaPlot Windows XYZ mesh plot. An SP5 format is used which is compatible with all versions of SigmaPlot.
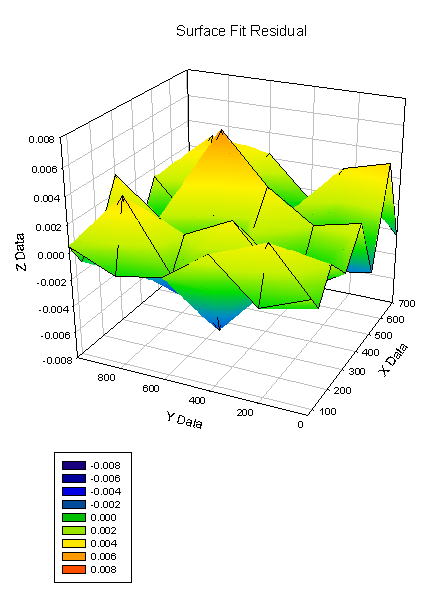
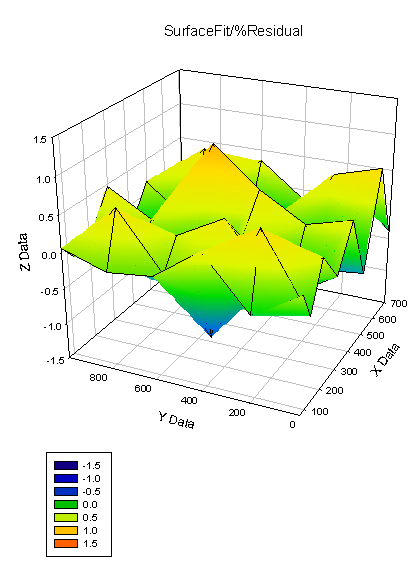
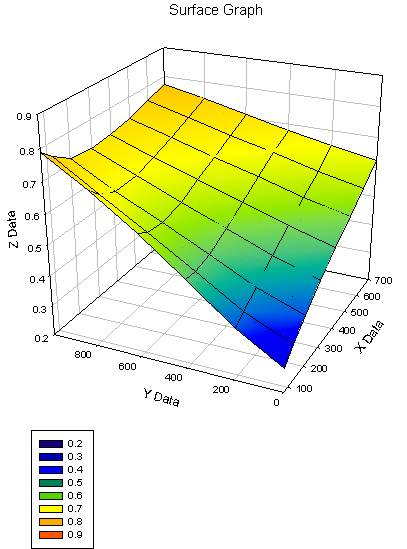
The SP2000/2001 format writes a SigmaPlot Windows file for use with SigmaPlot 2000, SigmaPlot 2001, and SigmaPlot Windows. This option is similar to the Full Worksheet option in that it contains all numeric information, but here the latest JNB file format is used, and four graphs are stored in the notebook. The two principal graphs are a surface graph containing the smooth fitted surface, and a residuals graph showing the errors in the estimation.
The initial default values for the generated data produce the actual mesh of the surface-fit graph. Note that when the TableCurve 3D graph mesh count is set to a very high resolution, such as the 250 x 250 maximum, 62,500 rows must be generated in the SigmaPlot file. This may require up to several minutes.
SigmaPlot 2000/2001 Surface Graph
SigmaPlot 2000/2001 Scatterplot
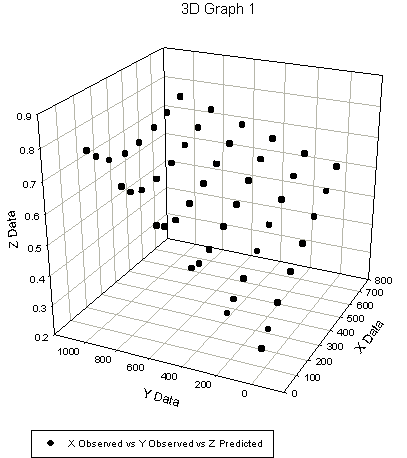
SigmaPlot 2000/2001 Residuals Plot