Smooth Loess
The Smooth Loess option in the Table menu offers an effective nearest neighbor Loess type of smoothing. This procedure works equally well with scattered or gridded data. The Smooth NURBS option is recommended primarily for data on a full or sparse grid.
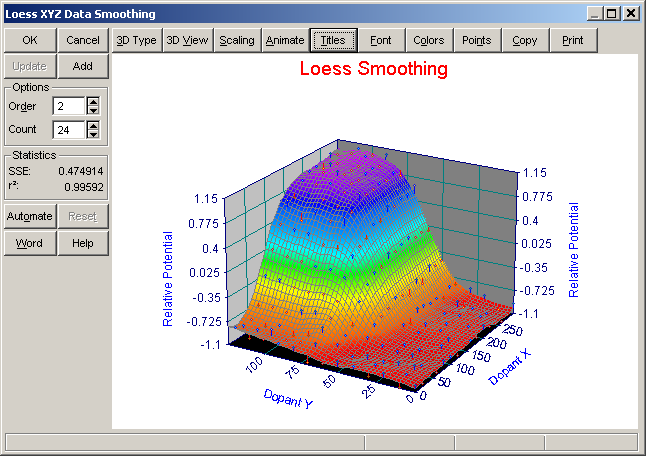
Smoothing Adjustments
The Loess algorithm contains two adjustments.
The Order determines the model to be fitted for smoothing, 1=planar, 2=bivariate quadratic, 3=bivariate cubic. The higher the order of the model fitted, the better features within the data will be preserved. For example the amplitude of 3D peak type data will suffer some attenuation with a planar fit but may suffer no loss with the 3rd order model.
The Count determines the number of nearest neighbor data points used in fitting. This can vary from that value which assures one degree of freedom in the fitting up to the total number of data points. The higher the number of nearest neighbor points, the greater will be the degree of smoothing.
Statistics
The SSE (sum of squares due to error) and r2 (coefficient of variation) are reported for the overall fit. The coloring of the data points by SE (standard error) relies on the assignment of degree of freedom based upon the local fitting function. This may furnish some evidence of outliers or possibly data that have been adversely impacted by the smoothing.
Surface Rendering
The surface is rendered by the Renka I procedure. This is informational only within this option.
Graph Controls
This option offers the common TableCurve 3D graph controls:
Add
 The Add button adds a Loess smoothing object to the currently selected XYZ data object in the TableCurve 3D explorer. A Loess smoothing operation can be added to any item containing XYZ data, including the smoothed objects themselves.
Update
If a Loess smoothing item is currently selected and the main graph is clicked, the Update button will be enabled. This updates the smoothing with the current settings as well as updating all graph customizations.
Batch Automation
The Automate button activates the TableCurve 3D Automation facility. This allows unattended processing of large numbers of data sets. The data sets can be consolidated in an Excel file or acquired using a DLL. The graphs and reports can be exported to a Microsoft Word/RTF file, while the processed data can be exported to an Excel 95 or Excel 97/2000/XP file.
If an Automation session is in progress, the Reset button can be used to terminate the automated processing.
MS Word/RTF Export
The Word button is used to save the current graph to either a MS Word file or a portable RTF (Rich Text Format) file. The graph is inserted into the file as a Windows metafile.
Preserving the Current Smoothing Settings
Exit with OK to update the smoothing settings. These values will be reflected the next time the procedure is entered. To discard the current settings, close the procedure with the Cancel button. Note that the Add or Update options must be invoked before closing the dialog in order for the smoothing to be added to the current notebook.