
Voigt
The Voigt is the convolution of a Gaussian and a Lorentzian. In spectroscopy the two are different physics. The Lorentzian is the line's own, homogeneous broadening: the finite lifetime of the states and collisional (pressure) dephasing. The Gaussian gathers everything else that broadens the line: the instrument's resolution, Doppler motion (thermal, turbulent, or the bulk motion of an astrophysical source), and inhomogeneous broadening from a distribution of local environments.
TableCurve fits the Voigt in these two convolution widths directly: the Gaussian standard deviation and the Lorentzian half width at half maximum, each with its own standard error and confidence limits.

w(z) is the complex error (Faddeeva) function; dividing by its value at the center makes a the height of the peak.
Parameters
a Amplitude, the height of the peak at its center b Center c Gaussian width, the standard deviation of the Gaussian d Lorentzian width, the half width at half maximum of the Lorentzian
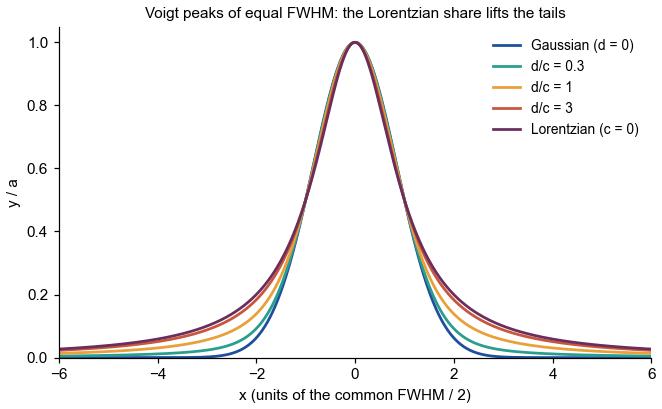
d = 0 is a pure Gaussian and c = 0 a pure Lorentzian. Both widths enter the profile symmetrically about zero, so TableCurve lets an iteration step through zero and takes the magnitude, rather than holding a width at a bound. A width that ends near zero is judged by its confidence interval (see Fitting below).
Equations
8562 Voigt_ the peak above 8563 Voigt with a constant 8564 Voigt+ with a linear baseline 8565-8570 2Voigt, 3Voigt: two or three peaks, every width independent 8793-8798 2VoigtW, 3VoigtW: one Gaussian width shared by all peaks 8571-8576 2VoigtS, 3VoigtS: one Lorentzian width shared by all peaks 8577-8582 2VoigtWS, 3VoigtWS: both widths shared Each multi-peak form comes without a baseline (_), with a constant, and with a linear baseline (+). Built-in function: VOIGT2(a,b,c,d), the same amplitude form and parameters
Area and Widths
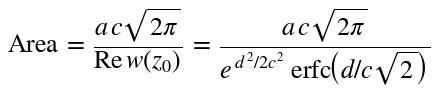

TableCurve reports the area, the Gaussian standard deviation and FWHM, and the Lorentzian half width and FWHM of every peak, with their standard errors. The Voigt FWHM has no closed form; the approximation of Olivero and Longbothum shown above is accurate to about 0.02 %.
Sharing Widths Across Peaks: W, S and WS
The Voigt is the one four-parameter peak in TableCurve with a W variant. In the other four-parameter models (EMG, GMG, LogNorm4, Gamma, Student t) the fourth parameter is a shape, and sharing follows the moments: the shape alone (S), or the width and the shape together (WS). Both of the Voigt's parameters are widths, from two distinct broadening processes, and either can be the one common to all peaks.
W, a shared Gaussian width. Peaks whose Gaussian broadening is set by the instrument: lines recorded on one spectrometer over a range narrow enough that its resolution does not change. Each line keeps its own Lorentzian width, its own lifetime or pressure broadening.
S, a shared Lorentzian width. Lines with one homogeneous width: components that share an upper state (hyperfine, isotopic or Zeeman components of one transition), or neighboring pressure-broadened lines of one molecular band. Each keeps its own Gaussian width (different Doppler or inhomogeneous broadening). Lines of different transitions, core levels or vibrational modes generally do not share a Lorentzian width.
WS, both widths shared. Lines broadened identically by both processes.
Independent. Unrelated lines: different species, different emitting regions, or a range wide enough that the resolution or the Doppler width changes across it.
When the physics supports a sharing, fit that variant. In TableCurve's tests on two- and three-line data that met the fitting conditions below, the variant matching the data recovered every line's widths in every set, in fewer iterations than the independent fit, which recovered 83-100 % of the same sets.
Choosing the Sharing
When the physics does not dictate the sharing, fit all four and compare them. In the same tests, on data meeting the fitting conditions, each of TableCurve's criteria chose a sharing that was true of the data in 88-100 % of sets. They differ in how readily they choose the simplest true one:
BIC and MDL choose the simplest true sharing most often (88-100 %): best when lines are expected to share a width. AICc is the most reliable for independent lines (95-98 %) but sometimes keeps an unneeded free width when a sharing is true (78-88 %). The F-statistic, used as an extra sum of squares test of each shared variant against the independent fit at 95 %, lies between them (91-98 %).
When the Lorentzian is much narrower than the Gaussian (d less than about a tenth of c), every criterion tends to prefer a shared Lorentzian width near zero even where the lines differ slightly. This is the correct conclusion: such data cannot measure a Lorentzian width that small, line by line.
Fitting
Two- and three-peak Voigt fits are reliable when the data support them: a signal to noise ratio of 30 dB or more, peaks at least one FWHM apart, each peak at least a fifth of the tallest, and at least 5 points per fitted parameter (10 with a baseline). With a constant or linear baseline the data should extend well into the tails, at least 5 Lorentzian half widths of clear baseline at each side, or the baseline and the Lorentzian tails compete for the same variance. A linear baseline under independent Voigts is the hardest of these fits. A two- or three-peak fit whose merit improves by less than 1 % over 100 iterations is ended as converged: such a fit is crawling along a narrow valley, and ending it costs no accuracy (in the TableCurve tests it halved the fitting time and changed no result on data meeting these conditions).
A Lorentzian buried in a broader Gaussian shows itself only in the far tails, where a Lorentzian of a tenth the Gaussian width rises above the Gaussian by only about 1 % of the peak height. When a fitted d is not distinguishable from zero by its confidence interval, the data have not detected a Lorentzian, and a Gaussian (or a shared d) describes them as well with fewer parameters.
Spectral Fitting Considerations
When fitting spectral peaks, x must be proportional to frequency, wave number or energy, and y must be a quantitative measure: convert wavelength to wave number and transmission to absorbance before fitting.
Depending on the Lorentzian character, part of a Voigt's area may lie outside the range of the data. The analytic area reported for the fitted peak will then exceed a numeric integration over the data's range.
A True Deconvolution
With the Voigt a true deconvolution occurs, and without the noise amplification of a Fourier deconvolution. When the Gaussian is the instrument response, the fitted Lorentzian (center b, half width d, and the area of the Voigt, which convolution preserves) is the line as a perfect instrument would record it.
Computation
TableCurve evaluates the Voigt through a rational approximation of the complex error function, the one PeakLab uses, with analytic derivatives for every parameter; its relative accuracy is better than 3E-10, far beyond the precision of any measured spectrum.
References
W. Voigt, "Über das Gesetz der Intensitätsverteilung innerhalb der Linien eines Gasspektrums", Sitzungsberichte der Königlich Bayerischen Akademie der Wissenschaften (1912) 603-620.
B.H. Armstrong, "Spectrum Line Profiles: The Voigt Function", Journal of Quantitative Spectroscopy and Radiative Transfer, 7 (1967) 61-88.
J.J. Olivero and R.L. Longbothum, "Empirical Fits to the Voigt Line Width: A Brief Review", Journal of Quantitative Spectroscopy and Radiative Transfer, 17 (1977) 233-236.
P.A. Jansson, Deconvolution of Images and Spectra, Second Edition, Dover Publications, 2012.