PeakLab v2 Documentation Contents R2N Software Home R2N Software Support
Import Chromatographic Data Sets (DAD/PDA)
Import Chromatographic Data Sets
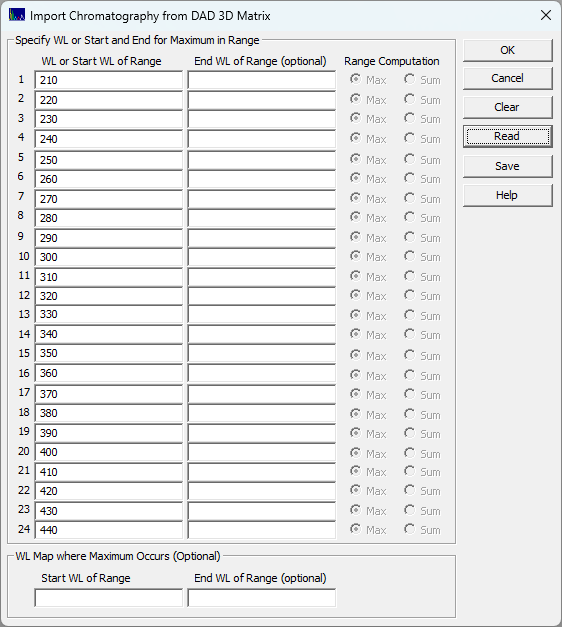
This ChromSpec menu option is useful for extracting the chromatography for specific wavelengths or wavelength bands of interest. These can be imported from multiple 3D matrices and multiple WLs, up to 24 total data sets in a single import step. You must first import spectra for this procedure to be available. When this option is selected, the following dialog appears:
The simplest import is shown above. Only the first WL column is used. In this example, the spectra from 210 to 440 are extracted from the matrix, and 24 data sets are generated. In this example, the import configuration was applied to a single 3D matrix. This may be useful for a more thorough exploration of the spectral-time surface.
The following plots use the 3D functionality in the View and Compare Data option to furnish strong 3D visualizations of the 24 chromatographic extracts from the time - WL spectra. The 3D gradient (ribbon), shaded, and contour plot visualizations are shown below:
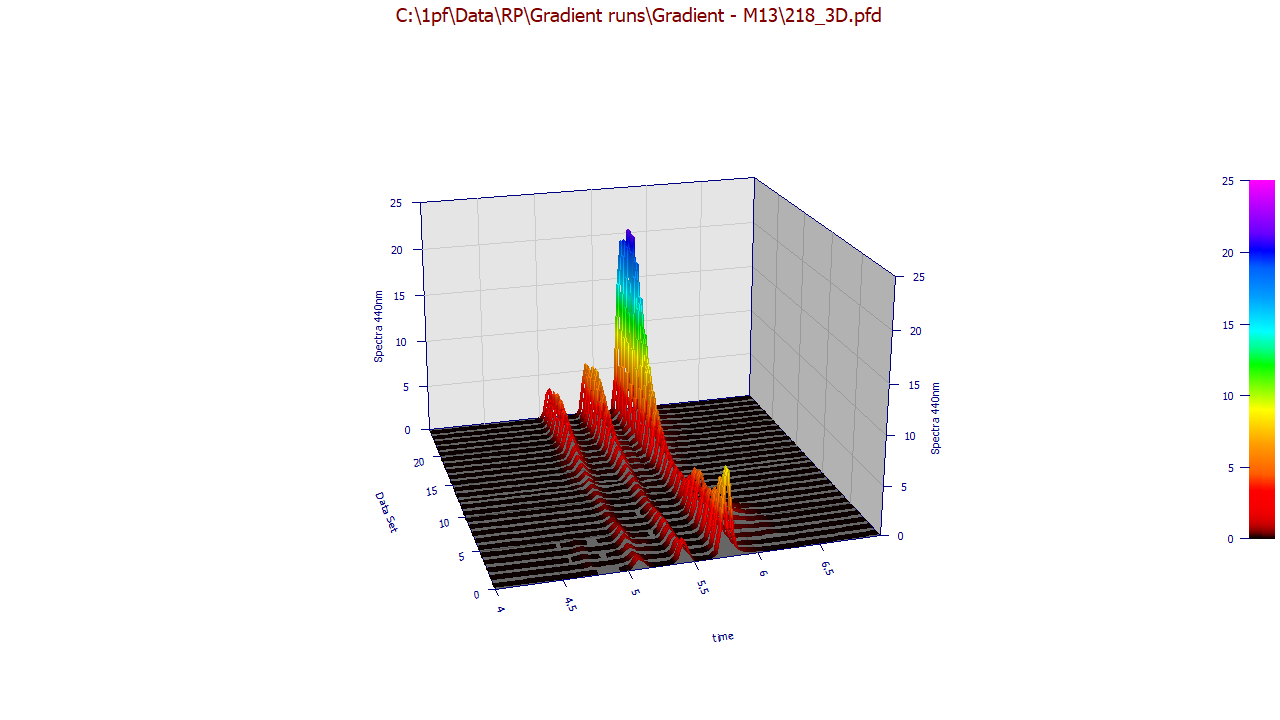
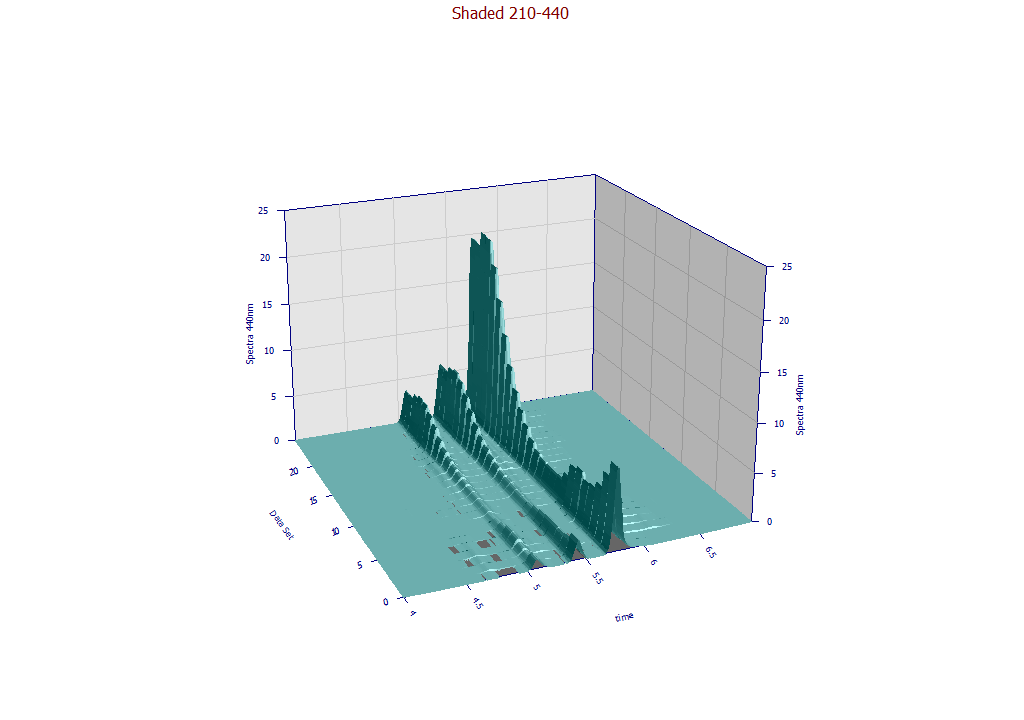
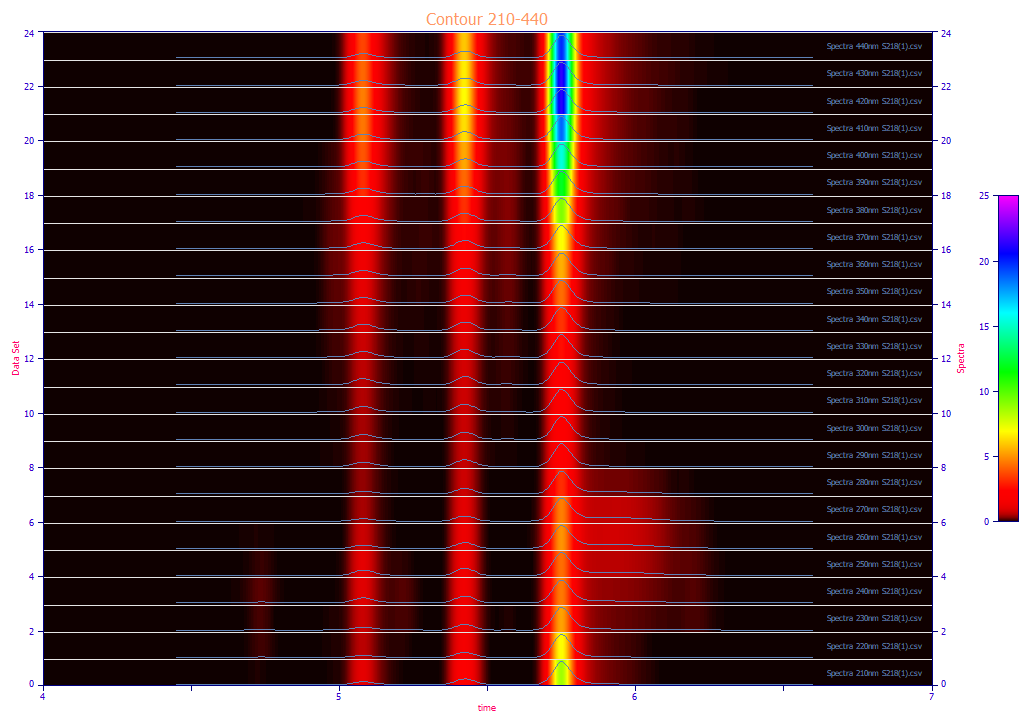
The contour patch plot option also plots a normalized chromatographic trace at each of the wavelengths in the plot. To zoom in a portion of the surface, it is often easiest to do this on the contour plot and then change to the 3D surface plots.
Extracting Maximums and Integrated Values in Wavelength Bands
If a range is specified with a starting and ending WL, you must select either the maximum (Max) or the sum of the spectral values (Sum) from the beginning to the ending WL specified. If you specify a WL range from 210 to 240, and Max as the operation, the resultant spectra will be the maximum DAD spectral value across this WL band for each point in time. Each spectral value may correspond with a different WL, the one where the maximum occurs at that point in time.
If Sum is selected, the spectra will consist of an integration from the starting to ending WL.
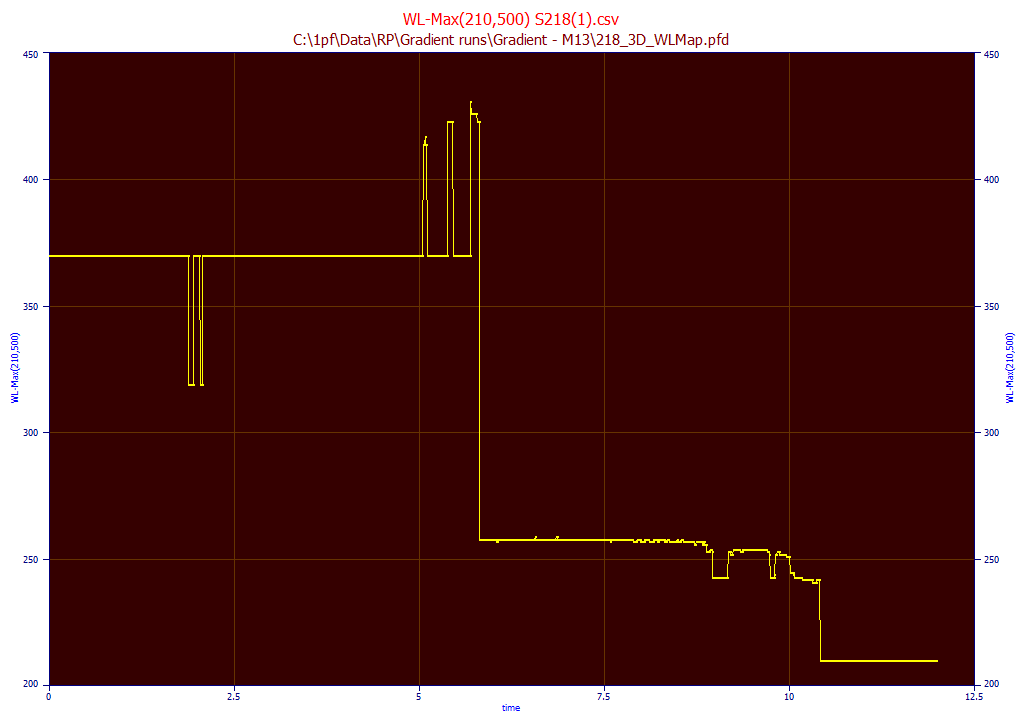
WL Map where Maximum Occurs
It can be useful to see the WL where the maximum occurs at each peak that is seen between any range of wavelengths. In this example, we specify 210 for the start and 500 for the end WL. This map will contain the WL value where the maximum occurs at each point in time in the elution. This can be a convenient way to isolate and identify components:
Digital Filtering
In this example, an Agilent DAD matrix with a 1 nm wavelength increment was used. When a 240nm wavelength is specified, the exact 240nm chromatography is extracted from the data matrix. Note that this may not exactly match the 240nm chromatography from the instrument. In the case of the Agilent instruments, there will be a Gaussian convolution DSP denoising filter that is applied to the WL-specific chromatography. In most cases, instruments include some type of DSP denoising filter, such as a Hamming or Savitzky-Golay filter, and it may or may not be possible to disable it. In our experience, the S/N will be slightly higher on the WL-specific data reported by the instrument. In the Agilent case, this digital filter will also add a slight measure of Gaussian character to peaks that that was not present in the actual separation, and this will to a small measure impact each of the fitted parameters in a generalized chromatographic model. Again, it is our experience that the digital filtering alters the fitted parameters; you will not see an exact match between the DAD extract and the specific WL data from an instrumental analysis. We will also note that the higher S/N and the denoising distortion tend to offset one another; the goodness of fit of a very well-fitted peak does not improve when using the DSP filtered data. Note that there is some possibility the DAD/PDA matrices will not reflect this denoising.
Interpolation
There may be instances where you need an interpolated WL value. An example would be where the first derivative technique is used to quantify coelutions and the DAD matrix consists of Savitzky-Golay first derivative (by WL) spectral values. Please see the Fitting Coeluting Peaks tutorial for more information. If a WL such as 240.275 is specified, for example, a bivariate spline surface (bicubic) is used to generate an interpolant that will be used to produce an interpolated WL spectra. Note that the Range Computations are not available when interpolation is being used. Those columns will be grayed out and inaccessible when the specified WL is not one of those within the actual matrix. Also, only interpolation is available. The available wavelengths are limited by the bounds of the matrix.
Reduce DAD/PDA Data Matrix
If you wish to visualize portions of the DAD matrix or reduce its size using only a portion of the overall UV-VIS wavelength bands, or reduce the time sampling if there are too many time samples, you can use the Reduce DAD/PDA 3D Data Matrix... option.
First Derivative DAD/PDA Matrix
Please see the Fitting Coeluting Peaks tutorial for a using identified zero first derivative wavelength values for estimating the areas of coeluting peaks with slightly different UV-VIS spectra.